The company’s roving cars travel hundreds of thousands of miles around the world. That makes them a useful tool for scientists.![[Photo: Google]](https://images.fastcompany.net/image/upload/w_562)
![[Photo: Google]](https://images.fastcompany.net/image/upload/w_562)
![[Photo: Google]](https://images.fastcompany.net/image/upload/w_562)
Air quality changes constantly. It could be safe to walk down one block, but the next one over could be so polluted that you need a mask. With so much variance, it’s difficult to measure air quality on the hyperlocal, block by block level–a problem for anyone trying to gauge pollution in cities.
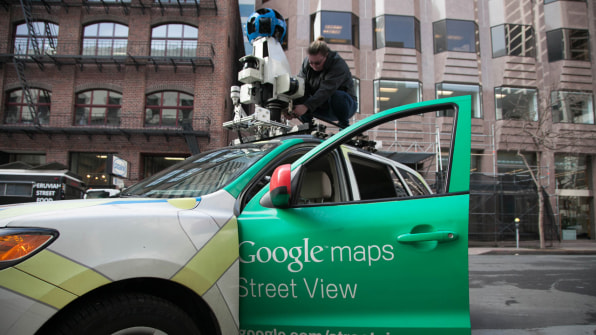
But what if cars themselves had air-quality sensors? That’s the premise of a pilot study from Google in which the tech company used its Street View cars to map air quality in some of California’s major urban and rural areas, block by block. The results of the pilot reveal a new picture of pollution in the state.

Starting in 2015, Google outfitted two Street View cars–the vehicles that provide street-level images of much of the world’s roadways–with air-quality sensors from Aclima, a data startup that builds environmental sensors that Google partnered with for the project. The Street View cars proceeded to drive 100,000 miles and more than 4,000 hours through the streets of California, collecting more than 1 billion hyperlocal air pollution data points, all of which is available upon request to scientists and researchers. For both companies, the project is a means of showing what their technology can do while providing a service for the communities of which they’re a part.
Now, the results are in. Google focused on three areas in California: the San Francisco Bay Area, the Los Angeles metro area, and the Central Valley. Heat maps of these three regions show the level of air quality on the streets on a scale from yellow, which represents high pollution, to blue, which represents low pollution. The maps themselves only show the quality of the air, from blue to yellow, on the roadways themselves. But they still reveal just how much air pollution varies from street to street, making it dangerous to make blanket assertions about the quality of air across an entire city.
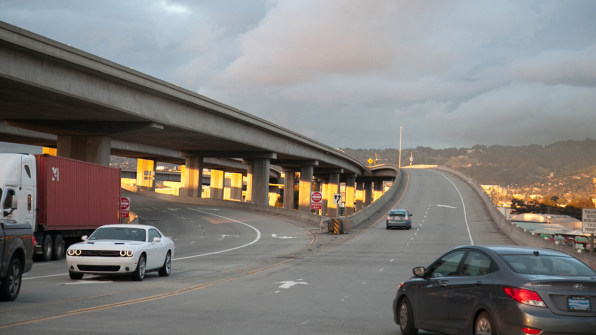
Unsurprisingly, the highest concentration of pollution in all three of the areas is along major freeways and streets. That’s a problem in Los Angeles in particular, where traffic is horrendous. The city’s geography doesn’t help either. Because the city is located near the ocean in a giant basin surrounded by mountains, pollution tends to get trapped–particularly when pollution is blown inland by the weather.

In the denser city of San Francisco, the air pollution maps indicate that vehicle emissions also play a large role in air quality, as well as from refineries and power plants. And in the Central Valley, which is mostly farmland, the central highways remain choked by air pollution, with emissions from industry and agriculture contributing to poor air quality as well. Aclima notes that adding weather information on top of the data reveals chronic ozone and pollution levels that are worse than what’s considered safe by public health standards.Aclima plans to continue parsing the data and releasing its analysis online. Google says it’s continuing to focus on collecting air quality data in California, but the company hopes to scale up its efforts. Having access to pollution data on the local level–similar to how we access weather information–could help people make more informed decisions about how to stay healthy. But it all starts with having the data in the first place.
–
